As Mobius continues to grow and evolve, we constantly update and improve to enhance the user experience. This article provides a comprehensive overview of the recent changes in Mobius. The recent changes are detailed below, referring to more complete articles about specific features.
Latest updates
Improved Import/Export Metadata (12-05-2026)
Improved Import/Export Metadata (12-05-2026)
Import/export tags and modules— item tags and modules are now included in product inventory exports, making it possible to easily transfer data between workspaces.

How does this work:
Exporting existing tags: export your product inventory! You'll see a new column with the tags that are attached to each item.
Please NOTE that tags are exported between " " (e.g. "tag") to separate them.
Importing tags: just add new tags you want to add to an item into the tags-column. Be sure to put them between " " to actually make the import work.
Deleting tags: deleting tags still happens manually. If you import an inventory that does not contain the tags, this will not remove the tags from your items.
Importing new tags: Mobius will pick a nice new color for your imported tags (as you cannot indicate the color in the import). Feel free to adapt the color in Mobius manually.
EPD Modules can now be imported and exported as well:
export product inventory including the EPD modules
import product inventory including the EPD modules
adapt EPD modules by importing the change.
Deleting EPD modules is still manual.
This also means that there is now a way to transfer tags and EPD modules between workspaces (for example during the database update process)!
Improved User Features, Streamlined Importing & Exporting (09-03-2026)
Improved User Features, Streamlined Importing & Exporting (09-03-2026)
Big File Import (Background Processing): You can now upload large files, such as extensive Bills of Materials (BOMs), without interrupting your workflow. Use the standard Import button, and the file will process in the background. You’ll receive an email notification as soon as the upload is complete. In the meantime you can close out the import tab and continue working.

Mass Export to Excel: Exporting multiple inventories just got easier. On the Products or Objects overview pages, you can now select multiple items and export them all to Excel in a single step.
Enhanced Overview Search: Quickly locate specific data by searching by name or description directly on the Products and Objects overview pages.

In-App Support Chat: Get help faster without leaving your model. You can now chat directly with the Ecochain support team and our trained AI via the new button in the bottom-right corner of the interface.

Guided product modeling & downloadable PCFs in Mobius (07-10-2025)
Guided product modeling & downloadable PCFs in Mobius (07-10-2025)
We're excited to introduce the all-new Guided product modeling and downloadable PCF reports in Mobius! What's new?
Set a goal for your product LCA: Define your goal to receive a personalised recommendation on the framework & method that suits your goal best.

Model with guidance: Model your product step-by-step with our guidance panels.

Instant insights: Access all insights in a single tab.

Unified Results: Explore all reporting options in one place, generate a Product Carbon Footprint (PCF) report, and export your inventory in Excel format.

Ecoinvent v3.11 and other dataset search improvements (30-06-2025)
Ecoinvent v3.11 and other dataset search improvements (30-06-2025)
New Update
The latest version of the ecoinvent database, ecoinvent v3.11, is now live in Mobius. This version brings over 1,000 new and updated datasets. Use it to improve the accuracy of your impact assessments with the most recent data available.
What’s new in ecoinvent v3.11?
Note – Full release note: Curious to know more? Read the full ecoinvent v3.11 release note.
Read the main improvements per industry
Read the main improvements per industry
Recycling: Expanded datasets for plastic recycling (PE/PP, PET, PS). Includes both mechanical and chemical recycling, with improved source attribution.
Paper: New datasets for fast food packaging (e.g., cups, lids, wraps). Updated kraft and carton production data.
Fuels: More granular supply chains for gas, oil, and coal across 57+ countries. Includes updated trade and import/export modeling.
Electricity: Grid mixes are updated for 2021–2022, plus 2023 residual mix data is now included.
Chemicals: New composite materials and improved supply chain connectivity. Includes 18 new chemical product datasets.
Batteries: Updated Li-ion chemistries, electrolytes, and graphite data.
Metals: Improved datasets for alloys, gallium, and scrap metals. Includes better pricing, properties, and mining data.
Construction: New Canadian-specific datasets for limestone and cement with updated concrete and mortar flows.
Agriculture: 136 new datasets covering Swiss crops. Includes regional details and both organic and conventional methods.
Forestry & Wood: Refinements to biogenic carbon flows and production volume updates.
Transport: Harmonized naming for transport datasets. Updated passenger car fleet data and new aircraft maintenance flows.
Pro tip - Database version: We always recommend using the latest database version for any new LCA projects to ensure compatibility and accuracy.
How to use ecoinvent v3.11?
To select ecoinvent v3.11 in Mobius:
First, go to the Workspace settings.
Then, select a compatible Impact assessment method (e.g., EF 3.1) that works with the ecoinvent v3.11 database (Figure 1).
Next, choose ecoinvent v3.11 as the Preferred database (Figure 1).
Figure 1: Selecting Ecoinvent v3.11 in workspace settings in Mobius.
Caution - Older database versions: Some older database versions (like v3.8) do not support newer methods such as EF 3.1. Mobius will show a warning (“invalid” icon) when combinations aren’t compatible.
Note - LCIA method compatibility: Ecoinvent v3.11 in Mobius supports the same methods as v3.9.1, including:
EF 3.1, EF 3.0
EN15804+A2 (2019, based on EF 3.1)
IPCC, TRACI 2.1, ReCiPe 2016, and more
What are other improvements to dataset searching in Mobius?
Smarter filters: Easily find datasets by filtering on recycled content and fossil vs biogenic carbon-containing materials (Figure 2).
Richer dataset info: Around 300 datasets now show recycled content shares (for plastics, metals, paper, glass, etc.; Figure 2).
Chemical search by CAS number: You can now search for chemical substances directly using their CAS numbers (Figure 3).
Improved reporting: Material datasets now include dry content, fossil carbon (C fossil), and biogenic carbon (C biogenic) fields (Figure 4).
Figures 2, 3, 4
Figures 2, 3, 4
Figure 2: Improved filtering and dataset info in Mobius.
Figure 3: Searching for datasets with CAS numbers in Mobius.
Figure 4: Improved dataset reporting in Mobius.
Update to MKI A2 weighting factor (01-05-2025)
Update to MKI A2 weighting factor (01-05-2025)
Caution: Deze update is alleen van toepassing op gebruikers die werken volgens de Bepalingsmethode 1.1 of 1.2 en de Milieukostenindicator A2 (set 2) gebruiken. De huidige MKI (A1, set 1) blijft ongewijzigd.
Geüpdatete MKI A2 (set 2) berekening voor verbeterde nauwkeurigheid
We hebben een update doorgevoerd in de berekening van de MKI A2 (set 2), op basis van de nieuwste weegfactoren van de NMD. Eén van de weegfactoren – die voor landgebruik - is recent aangepast door de NMD, en onze software is hier nu volledig op afgestemd.
Je zult mogelijk een kleine verlaging zien in de MKI A2-resultaten. Deze wijziging wordt automatisch toegepast en zorgt ervoor dat je resultaten actueel en in lijn zijn met de recente normen.
Er is geen actie benodigd vanuit jouw kant. Wil je meer weten? Neem dan gerust contact op met ons supportteam of je Customer Success Manager.
Meer informatie
De eerder gebruikte weegfactor voor landgebruik in onze software (0.000178) was gebaseerd op de consultatieversie, waarin het mid-scenario uit het CE Delft-rapport werd gevolgd (CE Delft). In de definitieve regelgeving is gekozen voor het low-scenario (0.000087), vanwege onzekerheid in de robuustheid van landgebruik data. Deze waarde is gepubliceerd op de NMD website en opgenomen in de definitieve regeling.
Caution: This update is only applicable for users who apply the Bepalingsmethode 1.1 or 1.2 to calculate the ECI A2 (set 2). The current ECI (A1, set 1) remains unchanged.
Updated ECI A2 (set 2) calculation for Improved Accuracy
We’ve implemented an update to the Environmental Cost Indicator A2 (set 2) in line with the latest NMD weighting factors. One of the impact category weightings – for land use - was recently revised by the NMD, and our software has been updated accordingly.
As a result, you may notice a slight reduction in your ECI A2 results. These changes are fully automatic and ensure your results are accurate and in line with the current standards.
No action is required from your side. If you’d like to know more, please reach out to our support team or your Customer Success Manager – we're happy to help.
More information
The previously used weighting factor for land use in our software (0.000178) was based on the consultation version, which used the mid-scenario from the CE Delft report as its source (CE Delft). The final official value (0.000087), published on the NMD website, reflects the low-scenario assumption from the CE Delft report due to uncertainty in land use data robustness. This value was adopted in the final regulation.
Impact results Excel with impact sources (03-04-2025)
Impact results Excel with impact sources (03-04-2025)
New Update
We’ve added a new ‘Impact sources’ tab to the Impact Results Excel to support transparent and detailed sustainability reporting.
What's new with the results file?
The Impact Results Excel for products, life cycles, and objects now includes a new tab: Impact sources. This improvement allows you to:
Easily copy and paste source information into your reports.
Add transparency to your LCA results and model.
Support audits or data quality reviews with clear source references.
This new tab displays relevant information for all items with environmental impact, helping you explain where results come from (Figure 1).
Figure 1: The new Impact Source tab in the Impact Results Excel export from Mobius.
You’ll see three types of impact sources in the Impact Source tab:
Datasets: Datasets from LCI databases like ecoinvent. Includes: dataset name, geography, database name, and version.
Elementary flows: The elementary flows are connected to impact categories in your LCIA method (set in workspace settings). Includes: flow name and emission compartment (e.g., air, water).
Custom impact: Manually entered impact values are listed with relevant input details.
How to access it?
The new Impact sources tab is automatically available in every Impact Results Excel file. You can export and download the Excel from the Tools menu for any product, life cycle, or object.
Note - Support: Reach out to [email protected] if you need additional support with the Impact results Excel for use in reporting.
Impact results EPD modules tab (14-02-2025)
Impact results EPD modules tab (14-02-2025)
New Update
Continuing with the improvements to the life cycle export feature, summarized impacts for EPD modules now have a tab in the Excel file.
What's new with the life cycle export?
In addition to the new inventory tab, the life cycle results file presents the summed impacts per EPD module to support compliance with EN15804 and EPD preparation.
Follow this link to learn how to use life cycle modules in Mobius.
NMD v3.9 in Mobius (29-01-2025)
NMD v3.9 in Mobius (29-01-2025)
New Update
We are excited to announce the release of NMD v3.9 in Mobius, offering enhanced compatibility with EN15804+A2 and significant improvements to environmental impact calculations.
What’s new with NMD v3.9?
Updated dataset categories:
New entries include bamboo products, recycled plastics, and updated cement profiles.
Enhanced accuracy for biogenic CO2, particulate emissions, and water scarcity impacts.
Enhanced MKI calculations:
NMD v3.9 integrates the new MKI A2 standard, with updated weighting factors for climate change and raw material depletion impacts.
Pro tip - Using MKI A2: Wonder why you should use the NMD v3.9 database? Well, if you’re a company in the Netherlands you will be required to calculate MKI A2 for Dutch tenders starting in January 2026.
For more on how to use and apply NMD v3.9 in Mobius, click here.
Life cycle impact results inventory tab (16-12-2024)
Life cycle impact results inventory tab (16-12-2024)
New update
We’ve enhanced the Life Cycle impact export feature to better align with product reporting. The update introduces a new tab displaying inventory results.
What's new with the life cycle results file?
You can now find a dedicated tab showing the environmental impacts of each inventory item, including used amounts and units.
This improvement allows you to break down the life cycle impacts more effectively, allowing for detailed reporting and analysis of your product inventories.
What's next?
EPD modules: Soon, we'll release an additional export file tab. It will provide the summed impacts per EPD module to support compliance with EN15804 and EPD preparation.
Exportable insights: Soon, you’ll also be able to download images of life cycle insights and comparison states, streamlining your reporting and presentations.
Database & Elementary flow search improvements (10-2024 -> 12-2024)
Database & Elementary flow search improvements (10-2024 -> 12-2024)
New update
This update introduces improved dataset search capabilities and streamlined categorization, designed to help you find relevant datasets and elementary flows more efficiently in Mobius. These enhancements include new sorting, filtering, and viewing options, simplifying your workflow, and making building accurate models easier.
What’s new with the database and elementary flow search?
The latest features and changes include:
Property filter: Filter datasets by properties (e.g., mass, energy content) for targeted results by excluding datasets with different properties.
Matching dataset count: The number of results for active filters is now instantly available.
Sorting options: Sort datasets by Name, Geography, Property (unit), and Database, allowing you to find grouped datasets, making comparison and selection easier. Elementary flows are also sortable by Name and Property.
Detailed dataset view: Enhanced descriptions and clearer viewing options for each dataset.
Compare datasets: A side-by-side view of multiple datasets to help select the best match.
Additional (dataset) categories to filter on: New, more practical main categories like Material, Transport, Energy, and Waste make it easier to narrow down to the most relevant datasets.
Geography filter enhancements: Now includes a list of all specific locations. Plus, grouping by Continent, Country, and Average is possible, enabling you to find the closest applicable dataset if an exact match isn’t available.
How to use the new features?
Sort datasets by choosing a sort criterion (e.g., Geography, Database) below the Dataset search bar (Figure 1).
Use matching dataset count (below the Dataset search bar) to gauge how filters impact your search. If zero results display, adjust filters to broaden your options (Figure 1).
Apply filters (e.g. Geography, Property) using the filter panel on the left side to refine search results (Figure 1).
Access (dataset) categories under the dataset search area to view and select relevant dataset types (e.g., material, waste) (Figure 1).
Compare datasets by selecting the blue 'Compare datasets' button at the bottom of the screen (Figure 1).

Figure 1: Accessing improved database search features like sorting, filters, matching dataset count, categories, and comparing datasets in Mobius.
Pro tip - Search operators: Use search operators like quotation marks for exact matches or the minus sign to exclude terms from your results.
New interface for Life cycle Comparisons and Scenarios (24-10-2024)
New interface for Life cycle Comparisons and Scenarios (24-10-2024)
New update
We’re excited to announce that the redesign for all the modeling and insight pages in Mobius is complete, including the Life Cycle Comparison and Scenario pages. These updates enhance your modeling experience making it easier to analyze, compare, and explore your product's environmental impacts.

What’s new with the Life cycle Comparison and Scenario pages?
This release note follows previous updates to Mobius’ interface. Here are the key changes and improvements:
Scenario editing: In Scenario mode, you can edit the scenario life cycle without altering the original model, giving you more flexibility to test improvements or changes (Figure 1). This includes:
Changing icons
Reordering life cycle phases
Modifying inventory items, amounts, and impact values

Figure 1: Editing a life cycle's scenario on the right, vs. original on the left
Side-by-side comparison: Both Scenario and Comparison modes allow you to view two life cycles side by side, with clear visual cues highlighting differences between the two. With this update, you can quickly spot variations in environmental impacts.
Sorting features: You can now sort the comparison table by phase, item name, impact, and unit, making it easier to identify key differences between life cycles (Figure 2).

Figure 2: sorting by different variables in the table visualization
Interactive donut charts: The donut chart allows for detailed exploration. You can click on phases to zoom into, using the impact legend to further explore the environmental impact of each phase (Figure 3).

Figure 3: Comparison of life cycles using the interactive donut charts
Ecoinvent v3.9.1, EF 3.1 method, and more (02-10-2024)
Ecoinvent v3.9.1, EF 3.1 method, and more (02-10-2024)
New update
We’re excited to announce the release of the Ecoinvent v3.9.1 database, featuring both new and familiar Life Cycle Assessment (LCA) methods. With this update, you’ll have access to the most current datasets and calculation methods, ensuring your analyses are as up-to-date as possible. Among the key additions is the new Environmental Footprint (EF) 3.1 method, now essential for meeting EPD International’s requirements. Stay tuned, as Ecoinvent v3.10 will be available soon, bringing even more improvements to support your LCA work.
What's new with ecoinvent v3.9.1
1,099 new datasets and 1,876 updated datasets were integrated, with around 271 new products added.
Sectors updated with version 3.9 include: Agriculture, Batteries, Chemicals, Electricity, Metals, Pulp and Paper, Oil and Gas, and Waste
Further information can be found on the ecoinvent website.
Ecoinvent v3.9.1 in Mobius is compatible with the following LCIA methods:
EF 3.0
EN15804+A2 (2019), based on EF 3.1
IPCC
TRACI 2.1
ReCiPe 2016
Many more in the updated LCIA Methods pack
What's the new content per sector?
Click the toggle below to see what's most relevant to our customers in the new ecoinvent v3.9.1:
Per sector
Per sector
Batteries: The update introduces new datasets for 'Lithium, Iron, and Phosphate' battery technology, expanding the database's coverage to five key battery chemistries. These datasets include specific battery components and updated information on battery separators and electrolytes.
Building and construction: The update includes new data for cement and concrete using recycled and waste-mixed aggregates. The global cement and concrete production datasets have been restructured, maintaining only the most representative datasets.
Chemicals and plastics: The update adds 36 new chemical products, including pesticides and plasticizers such as ethephon, triclopyr, and dioctyl adipate. Additionally, it introduces data on steam reforming technology for hydrogen production in Europe and globally, marking the first step towards improving hydrogen representation in the database.
Electricity: Ecoinvent v3.9.1 updates electricity market mixes for various regions, reflecting 2019 conditions and 2020 for the US, Canada, and Switzerland. Additionally, electricity mixes for China, India, and Brazil are updated. The update also includes detailed submarket data and new information on electricity transmission networks, covering aerial, underground, and subsea cables. Importantly, residual mixes are introduced using data from the Association of Issuing Bodies (AIB).
What’s new with using methods and databases?
Our new impact calculator is designed for speed. Most impacts are now precalculated, so they’re immediately available. For less common methods, you might see a spinner while the calculation happens in real time. Even in these cases, the process is now much quicker. New workspaces will have EF 3.1 as the default method and Ecoinvent v3.9.1 as the preferred database, ensuring you’re using the latest standards.
Workspaces are also more consistent in their use of databases and methods. We've updated how methods and databases can be used together in Mobius to ensure that only compatible combinations are selected for optimized impact calculations. Now, only supported combinations of methods and databases will provide impact results. If a combination is unsupported, it will display an "invalid" sign in the interface (Figure 1). This means the selected dataset cannot be calculated with the method chosen in the workspace settings.
Figure 1: Invalid sign and no impact shown in Mobius.
Caution - Database and method compatibility: Certain combinations of older databases/methods with newer versions will not be supported. Please ensure you select a matching LCIA method and preferred database and update your inventories accordingly. For example, databases Ecoinvent v3.8 and older are not supported with newer versions of the methods, instead Ecoinvent v3.9.1 should be used.
The NMD remains usable only with the current version of SBK Bepalingsmethode, while we wait for a new release by Stichting NMD.
Need to update existing models? To get impact results, you will either have to use a different version of the LCIA method or update the dataset. Updating a dataset can be done manually or in bulk with import/export. Hover over the invalid sign in the inventory to quickly edit and update the dataset (Figure 2). Caution should be exercised when updating existing models! Read the following article to learn more.
Figure 2: Edit icon used to edit and update selected datasets.
What's next for databases?
Ecoinvent v3.10 will be released soon, followed by NMD v3.9 with an updated SBK Bepalingsmethode later this year.
New interface for Adding impact (12-09-2024)
New interface for Adding impact (12-09-2024)
New update
Ecochain’s Mobius team is excited to announce a significant interface redesign for adding impact to your models in Mobius via the Database, Elementary Flow search, or Custom impact methods. This update aligns with our design and technical standards, improving both the appearance and usability of these features.

What’s new with Adding impact?
The three methods for adding impact have undergone design and technical improvements:
Database search:
Improved filtering experience with quick access to database categories in the left panel, and geographies and databases above the results (Figure 1).
Applied filters are easily visible and can be adjusted as you search.
Clicking a dataset opens the detailed view, providing comprehensive information and descriptions.

Figure 1: Accessing filters for database categories, geographies, and databases via database search in Mobius.
Note - Workspace settings and preferred database update: We've introduced a new "Preferred Database" setting in workspace settings. When selected, this database is automatically used as a default filter when adding impacts to your items. This feature helps streamline your searches and ensures consistency across all inventories in your workspace.

Figure 2: Applying a Preferred database in Workspace settings in Mobius.
Elementary flows: The Compartment filter has been revamped for better usability, allowing for easier navigation and selection.

Figure 3: Accessing elementary flow filters in Mobius.
Custom impact: The form for adding custom impact now features an updated design. The save and reset buttons are now always visible for a more streamlined experience.

Figure 4: Accessing custom impacts in Mobius.
These updates provide a cleaner, more intuitive experience when searching for and adding impacts. Plus, this redesign lays the groundwork for future enhancements to search, filtering, and result listings!
What’s next for Adding impact?
Additional updates to the database and elementary flow search will include custom categories, responsive filters, and the ability to compare datasets side by side.
New interface for Life cycles (19-06-2024)
New interface for Life cycles (19-06-2024)
New Update
At Ecochain, we want to make your environmental modeling journey easier. To achieve this, we have refreshed the Life cycles feature in our Mobius software. The improved interface aligns with Product pages, bringing a cleaner and more intuitive experience.

What's new with Life cycles?
Life Cycles have been revamped to match the product interface, offering a fresh and consistent look. Below is a breakdown of the specific updates.
Note - Update limitations: Some features from product pages, such as notation settings and image downloads, are delayed to free up capacity for other improvements.
The Model view
Explore new features on the Model tab, where you model your life cycle inventory. Key updates include:
Sticky footer: Quickly check the total impact of your life cycle with the new sticky footer (Figure 1).
Phase transformation: Life cycle phases have undergone a complete transformation.
The total impacts of phases are now displayed.
Creating a phase is always visible, and no longer hidden in the detail panel.
Quick changes are possible by hovering over a phase name or icon, and phases can be removed using the delete button.
Reordering phases is now done via a drag-and-drop interface (phases must be collapsed first).
Collapse all phases quickly with the "Collapse All" button.
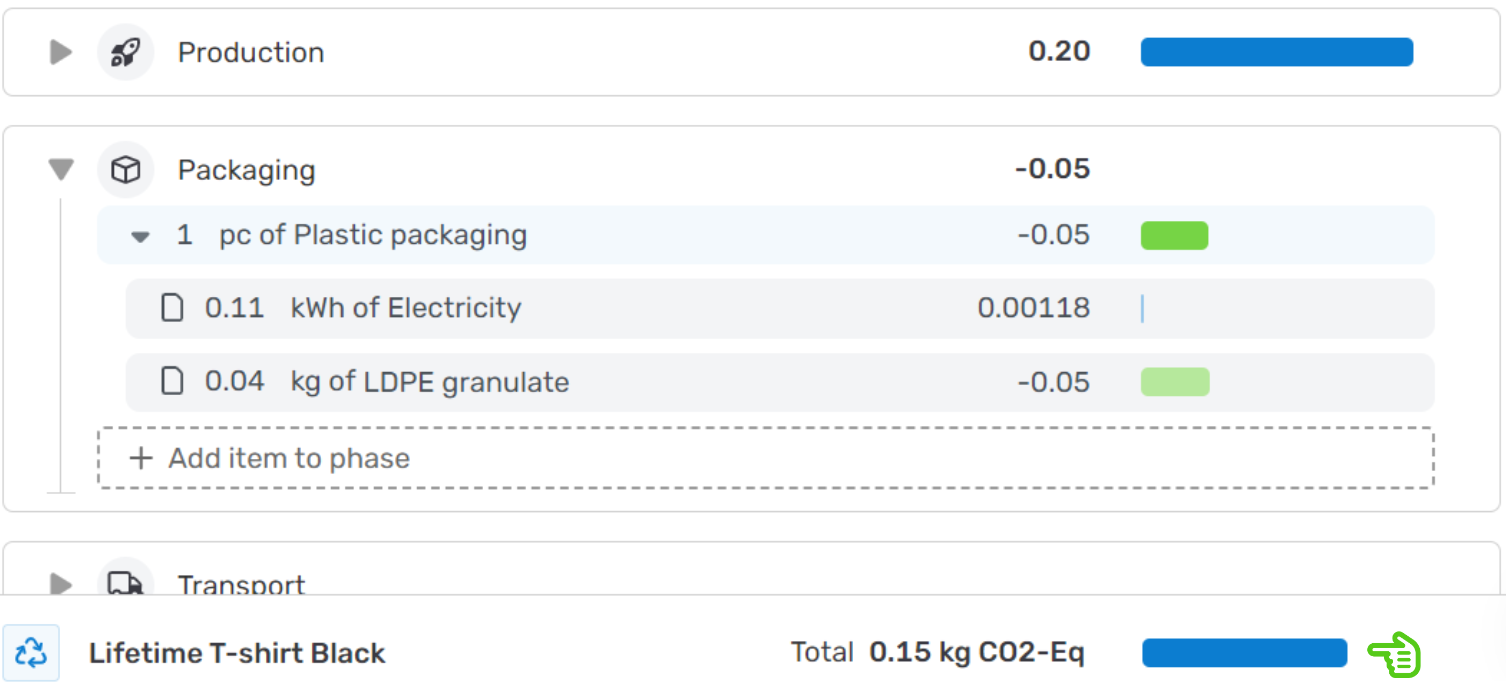
Figure 1: Accessing the model tab in the life cycle feature in Mobius. The arrow points to the sticky footer, which is always visible to display the total impact of your product.
The Table view
The Table now syncs completely with the product table. Notable changes include:
Total impact display: The bottom row shows the total impact (Figure 2).
Column sorting: You can sort all columns for better data organization (Figure 2).
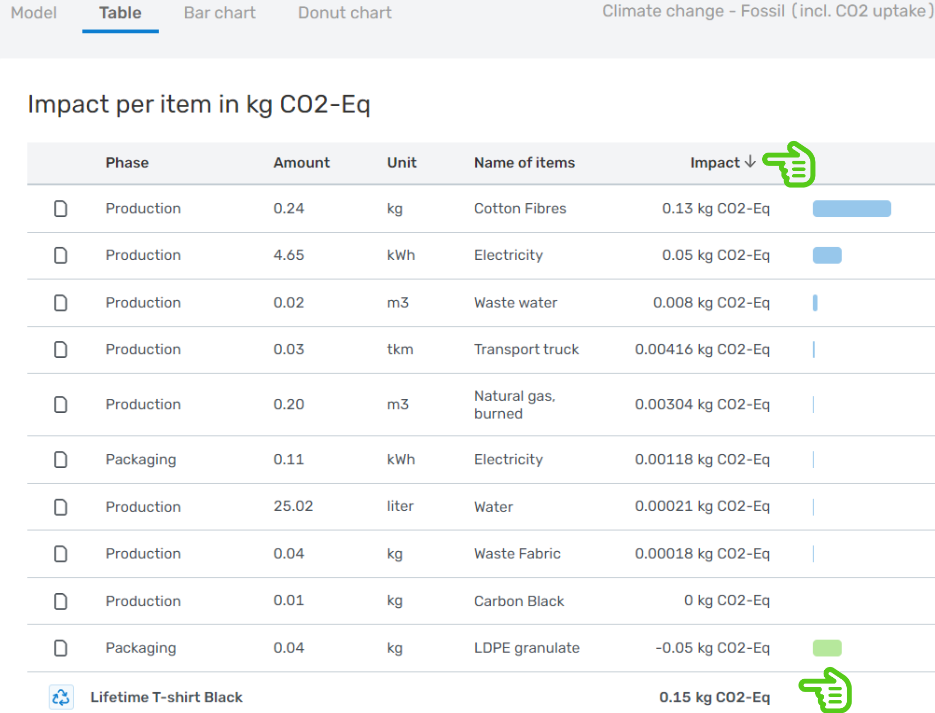
Figure 2: Accessing the table view in the lifecycle feature in Mobius. The bottom arrow points to the new total impact display. The upper arrow points to the new column sorting function, currently sorted on impact (highest to lowest). Any of the columns can be sorted.
The Bar chart
Life cycles now feature a new bar chart visual. Highlights include:
Vertical item list: Items in the inventory are listed vertically (Figure 3).
Negative impact display: A negative x-axis is included for displaying negative impacts (Figure 3).
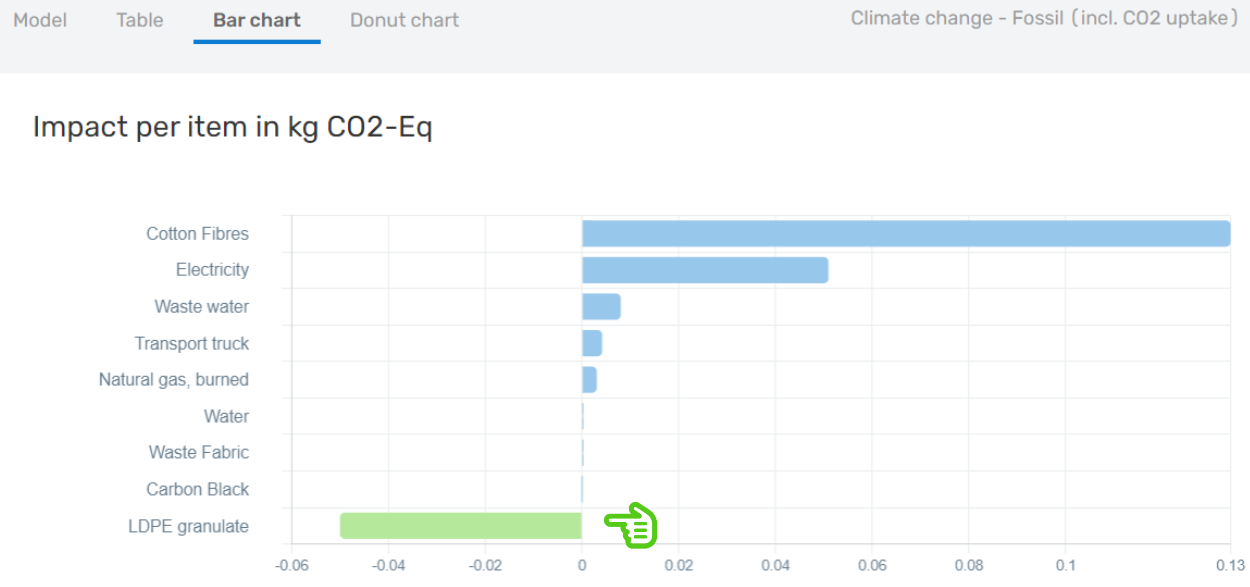
Figure 3: Accessing the bar chart view in the life cycle feature in Mobius. The bottom arrow points to the newly displayed negative impacts. Also, note the items are now listed vertically (y-axis).
The Donut chart
The donut chart has been enhanced with new features:
Legend: The impact of the life cycle phases and all items are labeled in a legend.
Contribution exploration: Click on a life cycle phase to zoom in and see detailed contributions of smaller items within the phase.
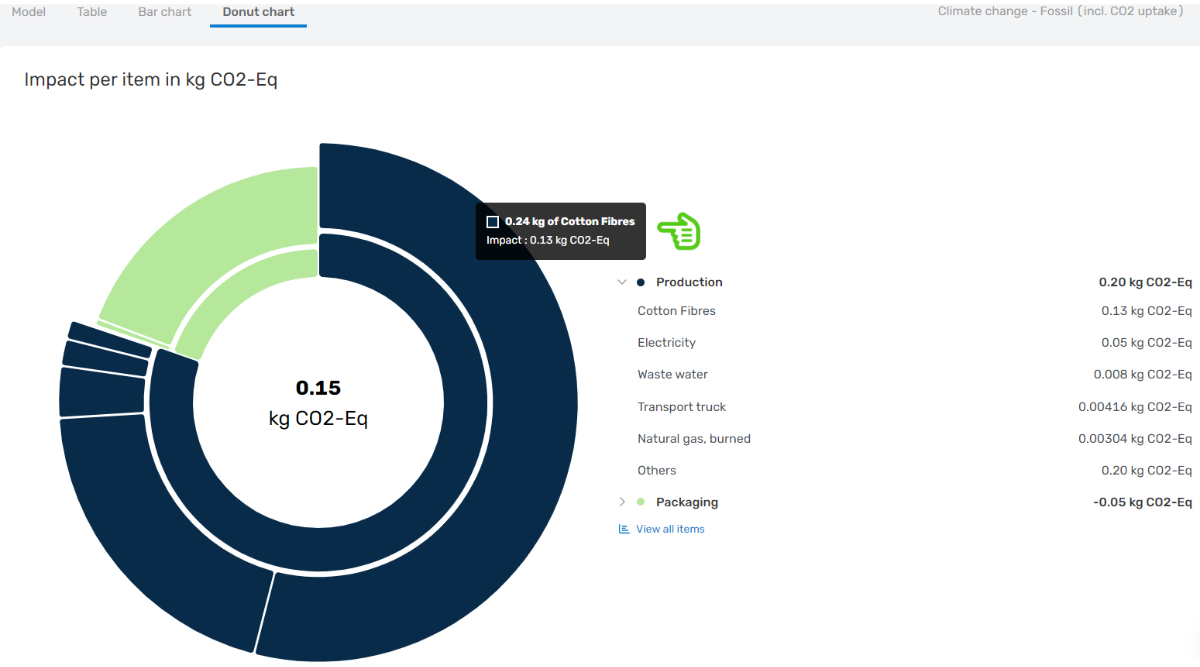
Figure 4: Accessing the donut chart in the life cycle feature in Mobius. The new legend is on the right-hand side, and the arrow points to the ability to explore the contribution of life cycle phases.
What’s next for life cycles?
In the coming months, you can look forward to more enhancements for life cycles in Mobius. We are planning a similar transformation for life cycle comparison and scenario analysis.
New interface for product Comparisons and Scenarios (02-05-2024)
New interface for product Comparisons and Scenarios (02-05-2024)
New Update
At Ecochain, we are dedicated to helping businesses create more sustainable products. In line with this commitment, we are excited to announce the Comparison and Scenario features in Mobius have been refreshed and revamped! This update comes with several enhancements to improve user experience and functionality.
What’s the difference between the Comparison and Scenario features?
While the overall behavior of the Comparison and Scenario features remains unchanged, it's important to understand the key differences between them and when to use each one:
The Comparison feature: This feature allows you to compare two existing products side-by-side, quickly understanding the differences between the products. At the same time, you cannot edit any details in comparison mode.
The Scenario feature: This feature allows you to create a new version of an existing (or original) product. The new scenario product appears in the Model tab alongside the original product for reference. Unlike the Comparison mode, you can change the scenario product without affecting the original product's inventory.
What’s new with the Comparison and Scenario features?
The Model tab
The Model tab, which contains the Product inventories, now features a harmonized design for both the Comparison and Scenario modes. When using either feature, the products are displayed side-by-side with labels indicating the original product from the compared or scenario product and “sticky” headers to ensure product names and total impact are always visible.
Based on user feedback, the scenario product has been relocated to the right side of the interface (Figure 1), and further design enhancements are being evaluated.
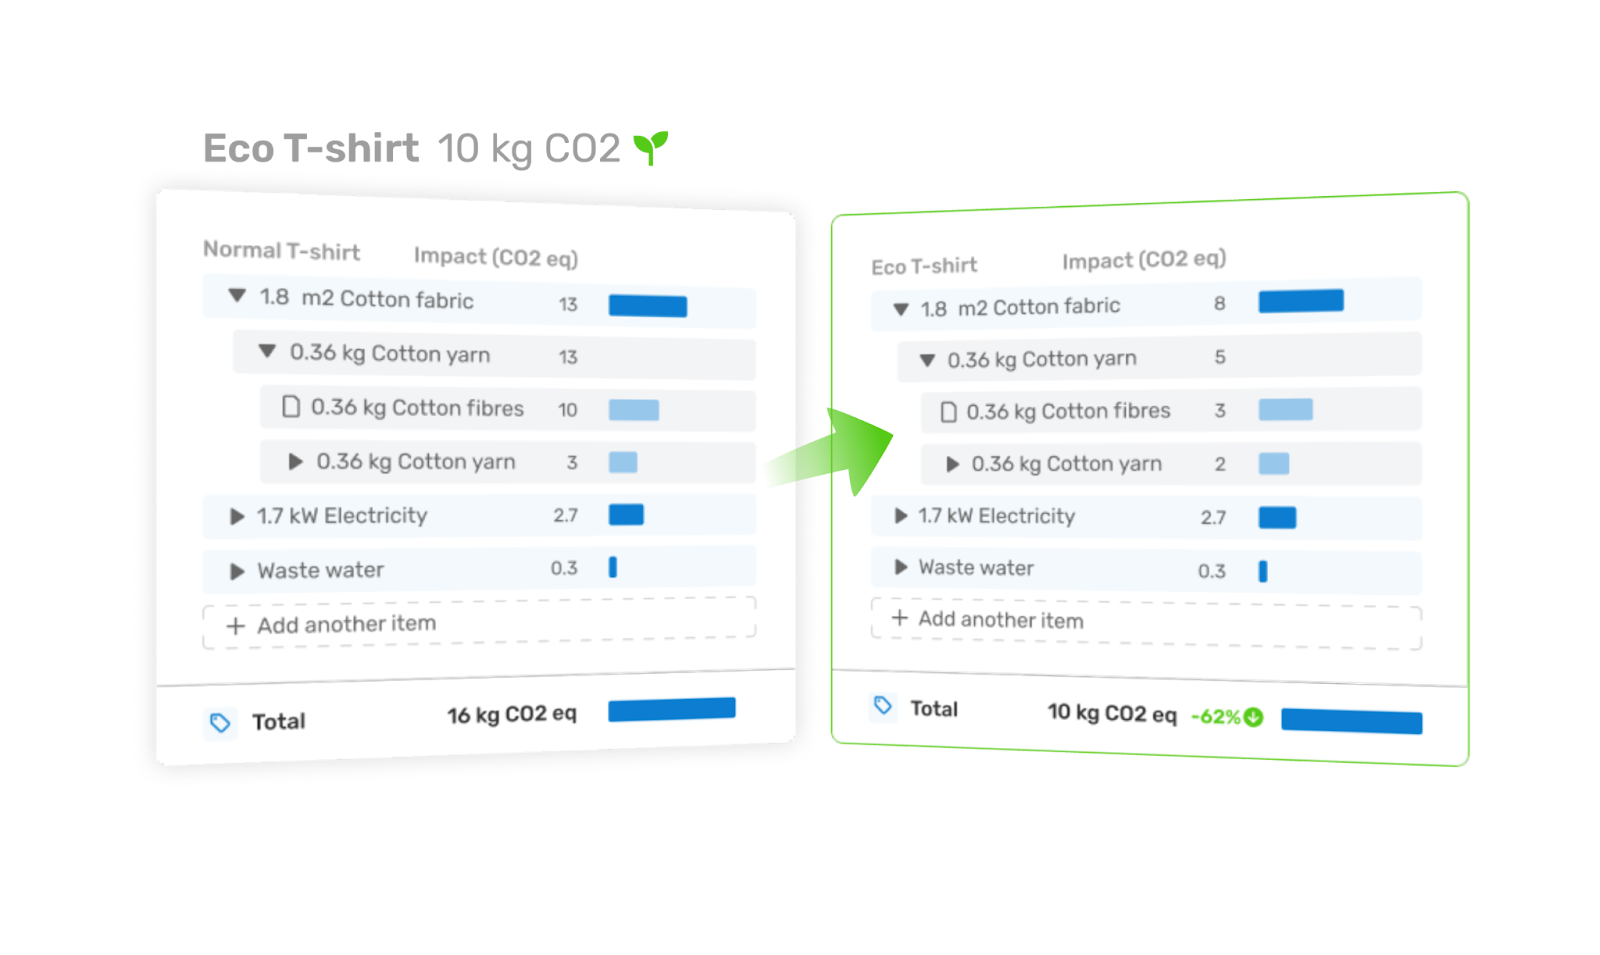
Figure 1: The updated Model tab for the Comparison and Scenario modes in Mobius.
The Table tab
The Table tab in Comparison and Scenario modes now presents the same design as it does for individual products and can be sorted on all columns, including on object’s units.
Pro tip - Sorting based on the unit: Sorting products’ objects based on the unit helps group similar items together, facilitating easier analysis.
The Stacked chart
The new Stacked chart visualizes environmental product performance at a glance (Figure 2). This chart aids in storytelling around environmental impact reduction efforts, color-coding objects to indicate their impact. Objects with negative impact (i.e., do not have negative environmental impact) are green, while impact items are in blue. Similar to the Donut chart, the Stacked chart enables you to quickly identify differences between products.
Note - Donut chart in Comparison and Scenario modes: The Stacked chart replaces the Donut chart when using the Comparison and Scenaro features. This is to allow for better visual comparison. In other words, the Donut chart is no longer available in Comparison or Scenario mode.
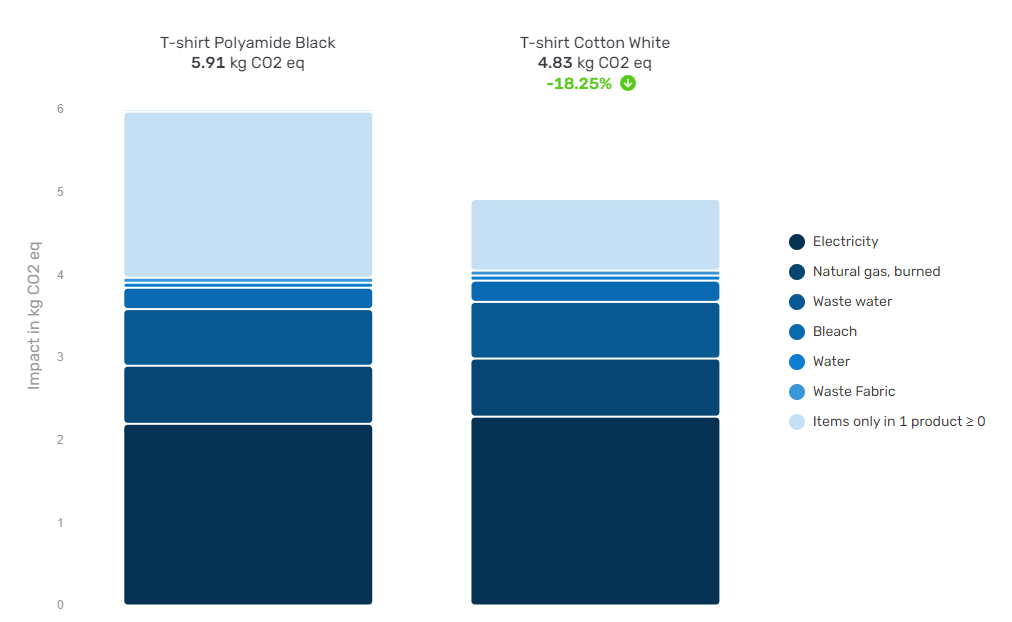
Figure 2: The new Stacked chart in Mobius.
What’s next for the Comparison and Scenario features?
The Bar chart
While unavailable in the current interface, the Bar chart will soon be introduced, allowing for side-by-side comparison of single objects. This feature is currently under development and is expected to be released in the coming months.
The Life cycles feature
Life cycles and the Comparison and Scenario modes within the Life cycles feature are currently in development and will be released shortly.
Product Template in Mobius (30-04-2024)
Product Template in Mobius (30-04-2024)
New Update
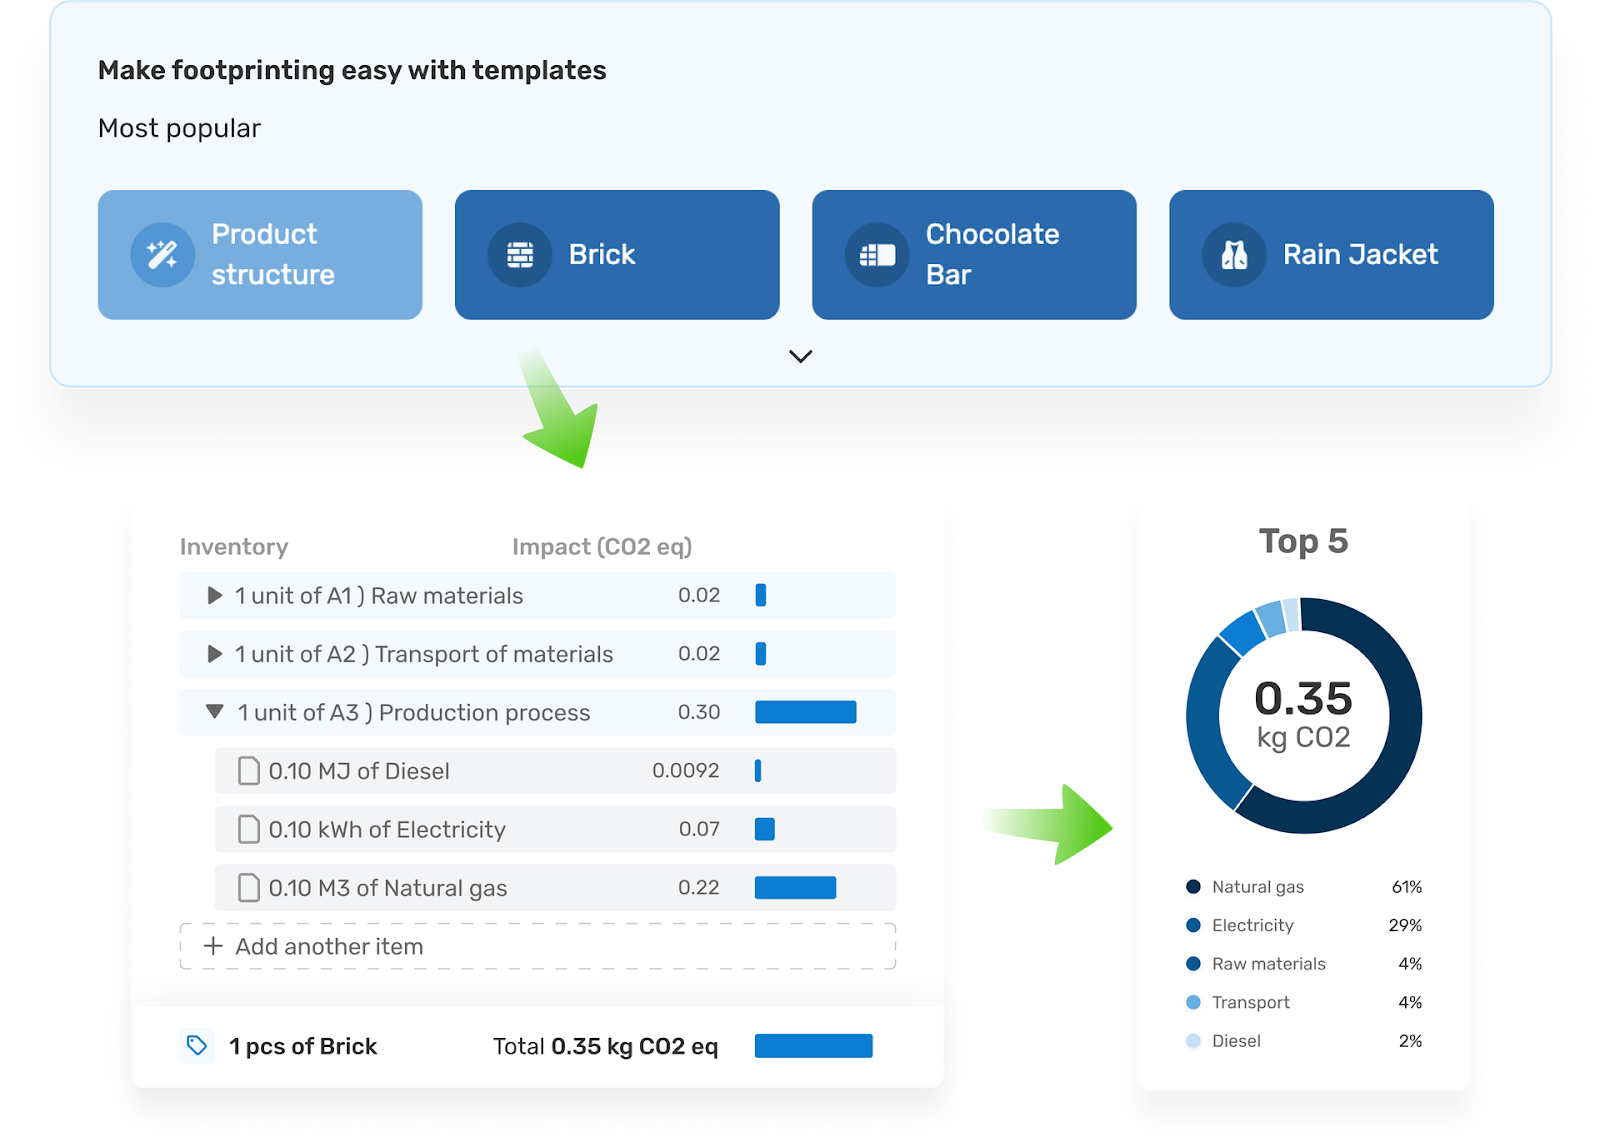
Take ownership of your environmental footprint with ready-to-use templates. Getting started with product footprints can be daunting. Well, not anymore! Mobius empowers you to create product footprints yourself.
With templates, you can:
Get started quickly - they guide you through modeling your product’s impact.
Choose from 10+ templates for various industries like apparel and textiles, food and beverage, electronics, packaging, and construction materials.
Items with impact - a detailed view (04-03-2024)
Items with impact - a detailed view (04-03-2024)
Welcome to another Mobius update😎. We have just released an update to items and objects with impact. With this update, the source of impact is no longer hidden in the detail panel 🔍. You can now immediately see to what source the item is linked to and have all the options to manage it directly on the Model tab.
Model tab
The impact's source now appears in the inventory with the following information and options:
Icon to indicate the source of impact; Dataset, Elementary flow or Custom impact
Amount and unit of the property required for the Dataset or Elementary flow. Make sure the amount and unit correspond to the main unit of your product so that the conversion to the dataset or elementary flow is correct. This can be edited in the detail panel of the item, in the Properties section.
View the name of your Dataset or Elementary flow
Click to see all the details of your Dataset or Elementary flow, like the database name and version, and any additional information provided.
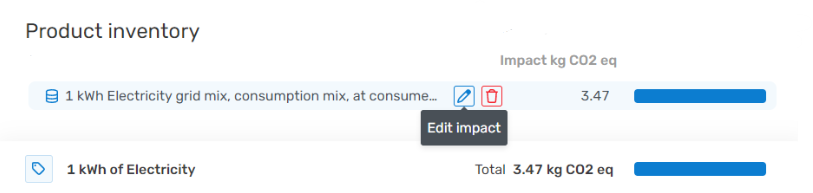
Edit the source of impact, to replace it with another dataset or another source of impact
Remove the source of impact. This will remove the impact (🤓) and give you the option again to add subitems to it to model your item differently.
Table, Bar chart and Donut tabs
The source of impact now also appears as a single item in the insights tabs.
Notation settings & inventory image downloads (19-02-2024)
Notation settings & inventory image downloads (19-02-2024)
What's new in Mobius? Last few weeks we have released many invisible improvements to improve the overall experience in Mobius. With this update, we would like to highlight a few new features you can explore. Read on to learn more!
Notation settings
You can now select in which notation you would like to view your results on the product's inventory page, as well as all Insight tabs. Choose between Number, Scientific and Percentage notations to display the values. Your selected settings will also show up in the Image downloads. Use it to specify how you would like to have your results visible to the ones viewing your images.
-png.png)
Numeric notation
This will be the new default notation for values shown in the Model and Insights tabs. Most values will be written out as numbers. Values bigger than 999,999 and smaller than 0.00001 will be displayed in scientific notation.
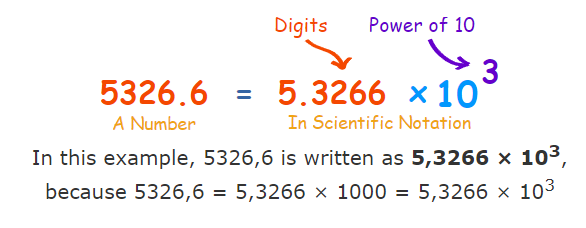
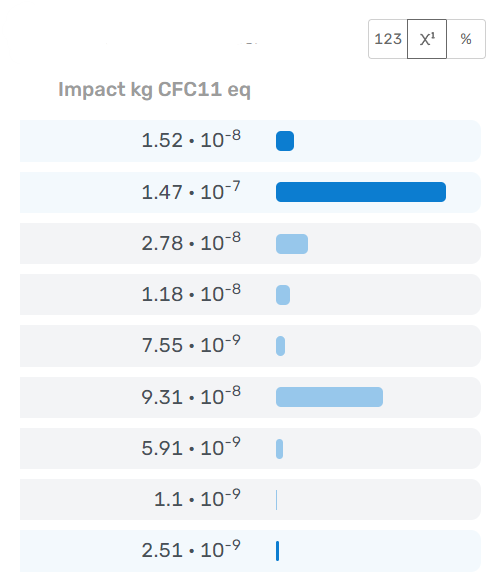
Scientific notation
With this notation, you can view very large and very small numbers using the same number of digits. It is a good notation to use when your product either has a very high or very low impact or when you are viewing impact categories like Ozone Depletion, which are expressed in tiny values, as can be seen in the example below.
Read the values as follows:
1.23 x 10^8 = 12,300,000
-1.23 x 10^8 = -12,300,000
1.23 x 10^-8 = 0.0000000123
-1.23 x 10^-8 = -0.0000000123
Percentage notation
This notation shows the contribution of the impact of the item on the total impact.
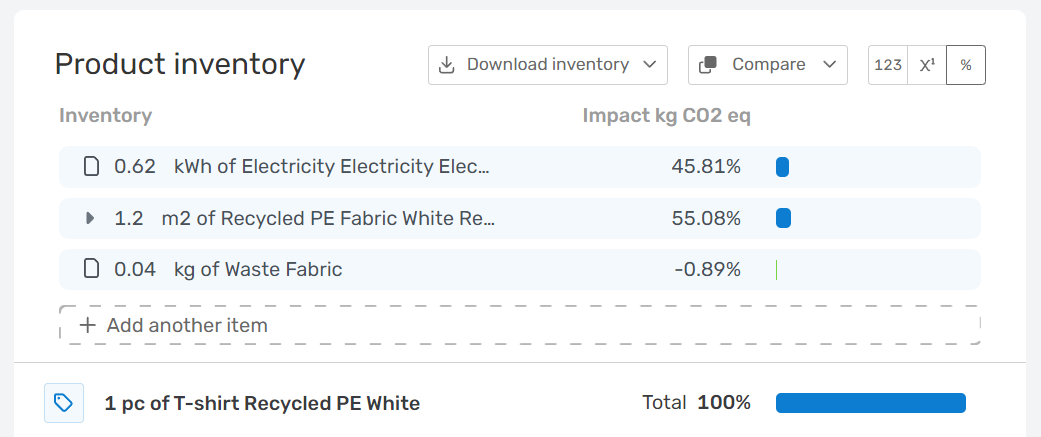
Image for the Inventory

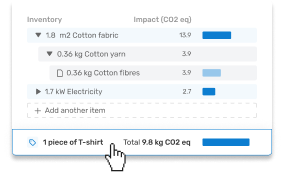
You can now download an image for all Insights, including the just-released image for the Inventory. Use the notation settings to indicate how the values are displayed. Also, try expanding or collapsing the levels in the inventory to display exactly what level of detail you would like to share. Handy if you want to share a high-level result, without the secret ingrediënts below 🤓.
Tip: Try using the percentage notation when you download an image so that you can share high-over the hotspots of your product footprint. This way you do not have to disclose an actual impact value, while you can still share how the impact is built up.
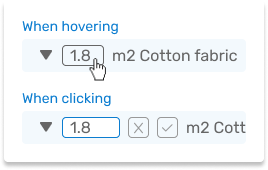
Edit amount in inventory
Here we have made several improvements based on feedback from our customers. The amount field can now only be used with a dot as a decimal separator so that it is in line with the other amount fields. Also, the size of the field will scale better when you type small numbers and it will not remove all zeroes behind a decimal separator anymore.
We consider creating full settings to control the decimal separator, notation settings and significant numbers. Stay tuned!
Performance improvements
Workspaces, their impact settings and the impact category dropdown should now load instantly. Also, improvements have been made to decrease the loading time when opening a product and loading is indicated with the spinning icon. Further improvements to the speed of actions in the inventory are coming up.
Products - Improved design & new exciting features (21-11-2023)
Products - Improved design & new exciting features (21-11-2023)
Welcome to our latest release notes. At Ecochain we strive to make product footprinting and life cycle assessments as easy as possible for you, through our Mobius software. We hope you enjoy our latest update to the Product inventory and Insights!
We listened to your feedback and have made changes to our overall design of the inventory, as well as the table, bar chart and donut chart views. We have also added functionalities that we believe will enhance your experience. Similar improvements are underway for Comparison, Scenario and Life cycles features. Stay tuned and do not hesitate to send us your feedback.

Inventory updates
The inventory got a completely new look 😍. And not just looks, there are some new features to explore too, all with one goal, to make it easier and more fun to model your products, improve their footprint and share your insights with colleagues. Simultaneously, the inventory by itself is a great communication tool, use it to explain how the product is made and where impact is coming from. Below we show some of the key updates.
Add item
The option to add an item to the main level of your product inventory is now always visible. Also, note that the colours of items and impact bars are different for first-level vs lower-level items. Impact bars of the same colour can be summed up to their higher-level item. Use it to quickly spot the highest contributors!

Edit amount
You can now directly edit amounts by clicking on them. Use the on-screen buttons, or 'esc' to cancel and 'enter' to save.
Total impact in footer
The main product has been moved to the footer and removed from the inventory tree. In this way, you can always see the product with its total impact, no matter how big your inventory!
Table, bar chart & donut chart updates
All insights got a big refresh and some new features to explore 🎁. With clear titles and options to sort, filter and download. You can use them to your advantage, learn where the impact comes from and create beautiful visuals to share with your colleagues and customers.
Download as PNG
You don't have to take screenshots anymore! Easily download images of graphs and tables with the download button.

Numbers & percentages
You are able to switch between numeric values and percentages in both your table view and your donut chart.

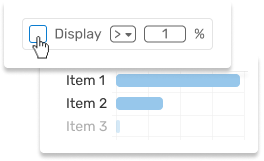
Bar chart - Filter out values
We have added a filter to remove specific values. You can adjust the values you wish to filter out and zoom in on others. With the > you can filter out values smaller than the indicated %, and only focus on those bigger contributors. Use the < to zoom in on the smaller contributors.
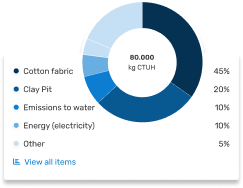
Donut chart - including a legend
The donut chart (previously sunburst) has a legend now! Values in the chart are sorted based on their impact (high - low).
FAQ
Did Life cycles, Comparison and Scenario get a new interface or features? No, at this time only the Product detail page has changed.
Will Life cycles, Comparison and Scenario get a similar interface for the inventory, table, bar chart and donut chart? Yes, they will all undergo a similar transformation and get overall improvements to their usability. We expect to release them, in phases, in H1 of 2024.
Can I get my Product in the previous interface? No, not readily. If you do feel like you need something from the previous interface, please let us know by chatting to us, or sending an email to [email protected].
Where can I share feedback or bugs? Send us a message 💬
IPCC 2021 method - AR6 (24-10-2023)
IPCC 2021 method - AR6 (24-10-2023)
Summary: IPCC 2021 method is available in Mobius. Start using this method to perform Product Carbon Footprint (PCF) calculations according to ISO 14067.
![]()
IPCC 2021 method in Mobius allows us to perform carbon footprint calculations in line with the latest emission factors published in the AR6 report. The Intergovernmental Panel on Climate Change (IPCC) has delivered Assessment Reports (AR) at regular intervals - typically every 6 years - since 1990 until 2021. These AR reports summarize the latest scientific findings on climate change, and serve as key references for governments and organizations when developing climate policies and strategies.
🔬Find the AR reports on the IPCC website.
How can I start using IPCC 2021 in Mobius?
Go to Workspace settings/Impact Settings and select "IPCC method" as your Impact method set. Then, you have the possibility to choose between the standard IPCC GWP100 AR6 (2021) or the one including CO2 uptake. In general, the standard method is recommended. This version of IPCC method does not take into account the effect of biogenic (non-fossil) Carbon Dioxide, while the including CO2 uptake takes into account the influence of biogenic CO2 capture and emissions.
💡Visit this article to learn how to change the impact method sets, the impact assessment method and impact categories.
When should I use IPCC 2021?
IPCC 2021 is recommended when conducting Product Carbon Footprints (PCF). PCF is the process of quantifying the greenhouse gas emissions associated with a product's entire life cycle. ISO 14067 and Pathfinder Framework - developed by The World Business Council for Sustainable Development (WBCSD) - provide guidelines on the assessment and reporting of such calculations.
⚠️ Be aware that IPCC only provides Climate Change impacts and that this exclusive focus could result in insufficient attention to other important environmental impacts, such as Resource depletion, human toxicity or eutrophication. We recommend to select other LCIA methods if you want to have an overview on the rest of impacts: EF method, or EN15804+A2 in construction sector. Read this article to know more about the difference between PCF and LCA.
What are the differences between IPCC 2021 (AR6) method and its predecessor, IPCC 2013 (AR5)?
Acknowledging that calculations based on these versions are NOT directly comparable is crucial. According to our knowledge, average deviations in PCF results typically remain under 10%. However, the question remains: where do these differences originate?
New knowledge on physical behavior of Greenhouse gases (GHG) - such as lifetimes, impulse response functions and radioactive efficiencies - leads to adjustment on the Global Warming Potential (GWP) values. These GWP values determine the pressure on climate change posed by each GHG emission (i.e. CO2, CO, CH4, N20). Meaning that updates on such values can increase or decrease the impact of such emissions on climate change.
For instance, Carbon cycle (cc) feedback plays a key role determining GWP values (as shown in table below). This approach considers how emissions of non-CO2 greenhouse gases, such as CH4 and N2O, can indirectly affect CO2 concentrations and atmospheric warming by impacting natural processes like vegetation growth, carbon sequestration, and permafrost thawing. Including carbon cycle feedback can lead to higher GWP values for non-CO2 greenhouse gases over shorter time horizons (e.g., 20 years). Whereas excluding cc feedback is often recommended for GWP calculations over longer time horizons (e.g., 100 years), where the effects of indirect carbon cycle feedback are less pronounced.
The following table shows the GWP factors of some of the most important GHG emissions:
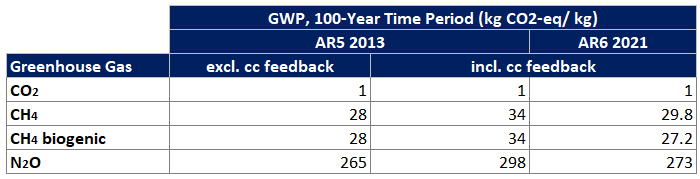
👨🏫For more information on the content of these reports you can visit IPCC website
🤓To calculate based on AR5 2013 (excl. cc feedback): Go to Workspace settings/Impact Settings and select "OpenLCA LCIA methods v2.0.4" as your Impact method set and "IPCC 2013 GWP 100a" as impact method.
Updated Overview pages (20-07-2023)
Updated Overview pages (20-07-2023)
A small update today for the sharp-eyed among us! You might notice small styling and behavioral changes on the Product, Life cycle, and Object overview pages and a few small new features 👀.
The action menus now have icons, to make them more clear and to make it overall a better experience.
Another small update is the indication of the sorting state on the card overview. You can now see how the card overview page is sorted, and by clicking it you can select another field to sort by. Clicking the arrow will reverse the sorting.
Also, several small bugs have been resolved. It is now possible again to edit the dataset while on the overview page. And also sorting and searching are possible while remaining within a folder.
